Statera
Managing Team Performance in Varsity Sports
[UX Research, UX Design]
TEAM
Amrita Sakhrani, Michael Silvestre, Kathy Song
TIMELINE
Nov 2019 - Dec 2019
ROLE
UX Design Lead
CHALLENGE
High School varsity athletes had trouble balancing their workload in addition to practices and competitions, leading to stress and burnout, and prematurely dropping out of the team.
SOLUTION
Giving coaches access to students academic workoad in order to better optimize training schedules and team performance. The mobile application we designed, Statera, means ‘balance’ in Latin, and allows both students to enter their stress levels if desired and for coaches to be able to optimize swim practices based on exam schedules. In addition, swim coaches are able to easily offer athletes tailored guidance based on individual performance records.
IMPACT
Successful pitch to the community and the local swim team wanting to test it out.
GOAL
How might we establish a conversation around emotional health, between coaches and student athletes, to increase swim performance and build better coach-athlete relationships?
RESEARCH
Understanding the culture of youth sports through Guerilla Research
To begin to understand the problem space we spoke to a wide variety of individuals in the local Pittsburgh area at bus stops, coffee shops, museums and on the street. We began to understand the connections individuals had to those in their lives that had participated in youth sports. Among the interviews, we had the opportunity to speak to an assistant soccer coach and the parent of an ex-varsity athlete.
COMMUNITY
Youth sports can be seen as the crux of local communities today.
TEAMWORK
It brings joy, healthy sportsmanship, and also permeates into close friendships.
IDENTITY
The dedication to a competitive sport helps shape the identity of a young teenager.
Understanding different perspectives through Semi-Structured Interviews
After identifying some pressing questions we had, we chose to scope out some more people to interview. This time, we reached out to coaches (both collegiate and recreational) as well as parents with children that participated in high school swim teams. We broke off and did this research separately, and then met together and discussed the details of each interview.
This proved really interesting. We noticed very similar touch points with our coaches and parents as we talked about what we learned. This also gave us a very clear idea of some of the tools that were prevalent during the swim practice and swim meet process.
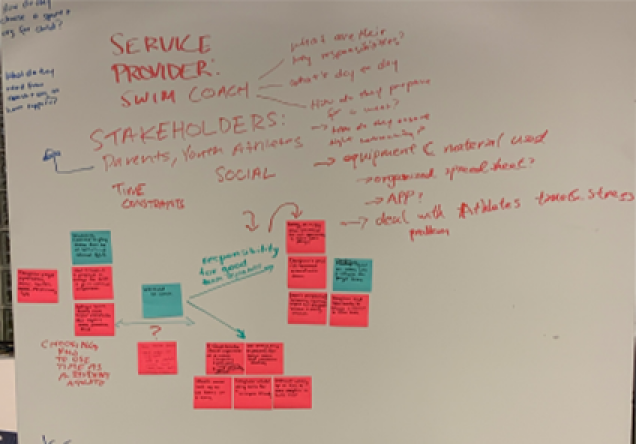
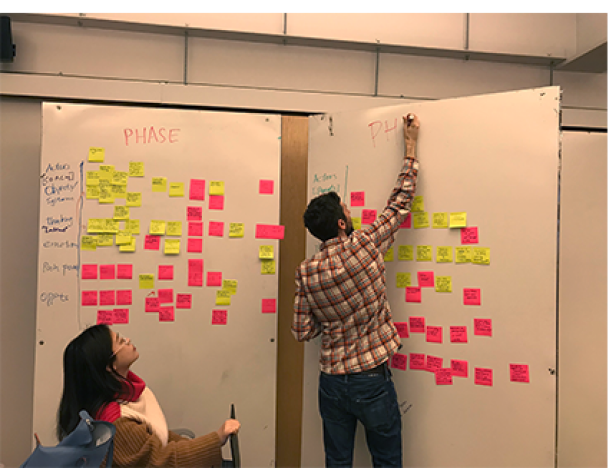
Discovering pain points through Customer Journey Maps
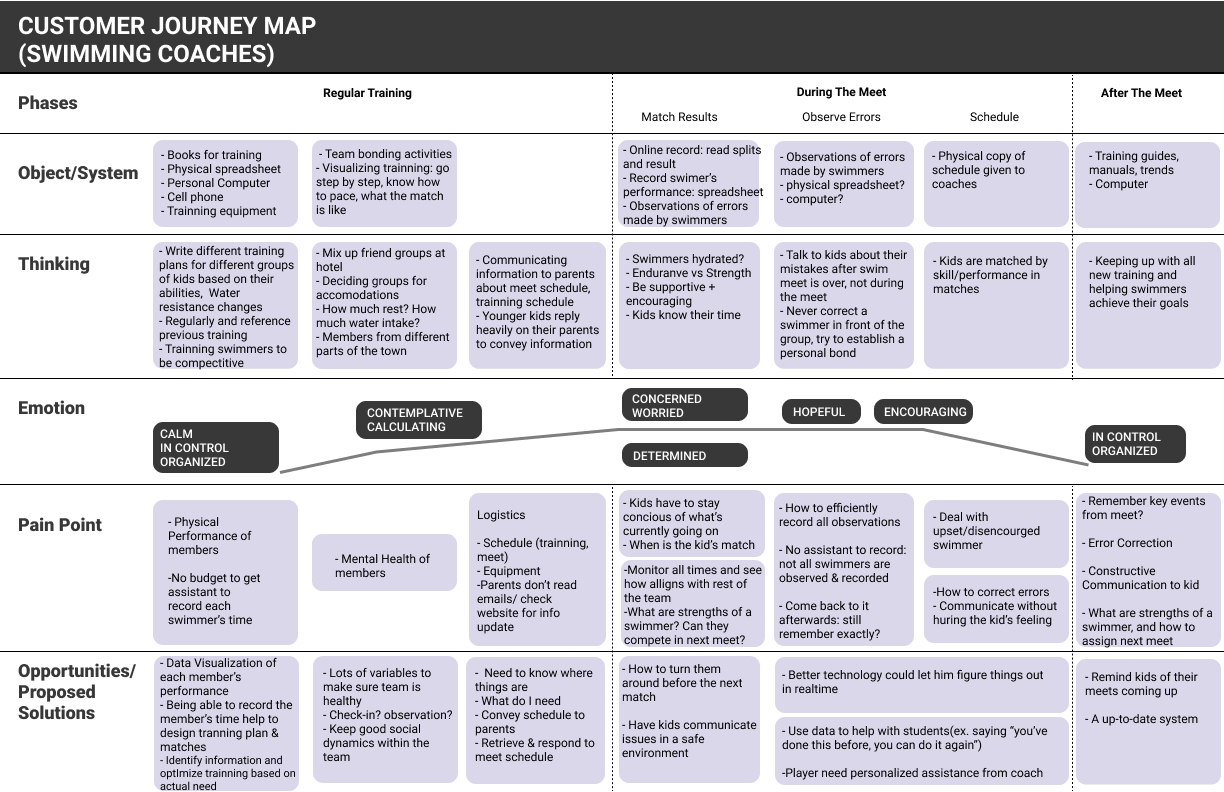
Coach Pain Points
1. Hectic nature of meets and training sessions creates lack of attention
2. Coaches want to have a better understanding of swimmer’s workload
3. Difficult to consider all aspects of an athlete to create productive practices
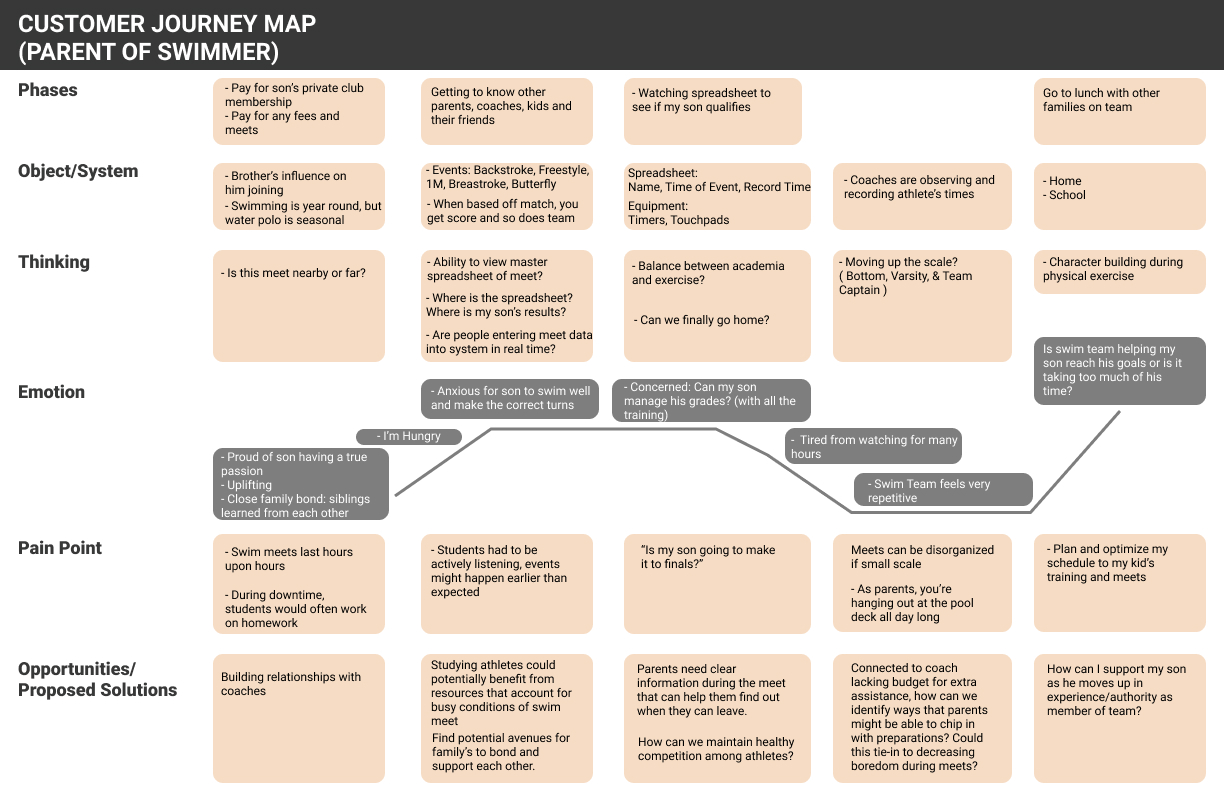
Student Pain Points
1. Current culture of high school sports places a large volume of stress
2. Athletes don’t feel comfortable sharing this distress
3. Sleep deprivation and stress can lead to poor performance
At this point, we realized how mindful we had to be with creating our mobile experience, as coaches often stood as close to the edge of the pool as possible. Also, with so much focus going towards the competition, we needed to make sure that a mobile experience did not distract coaches from this important facet of their jobs.
Most importantly, we realized how much data is generated during a swim meet. We were vaguely aware of this, but since most of this information was displayed through non-digital mediums, the extent of how much paper is used to convey all of this information was really striking for us.
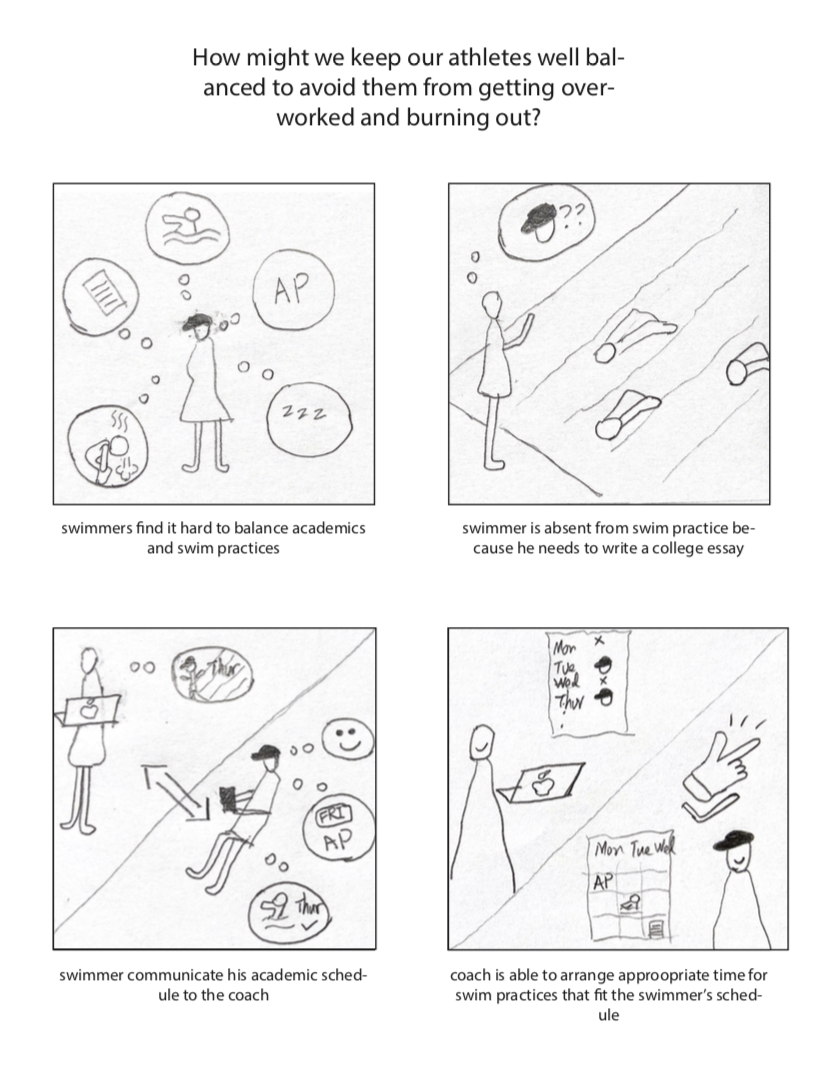
While sitting in the bleachers, we were also able to get a sense of the parent and relative perspective of watching a game. This also gave us further opportunity to speak with parents of swimmers, which taught us about an existing app in the domain called MeetMobile, which gives lives updates of swim meet results.
To test the boundaries of conceptual protoypes for coaches and athletes,
we Speed Dated six Storyboards
Needs:
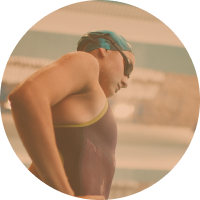
How might a swimmer safely and effectively communicate his/her academic stress level to the coach?
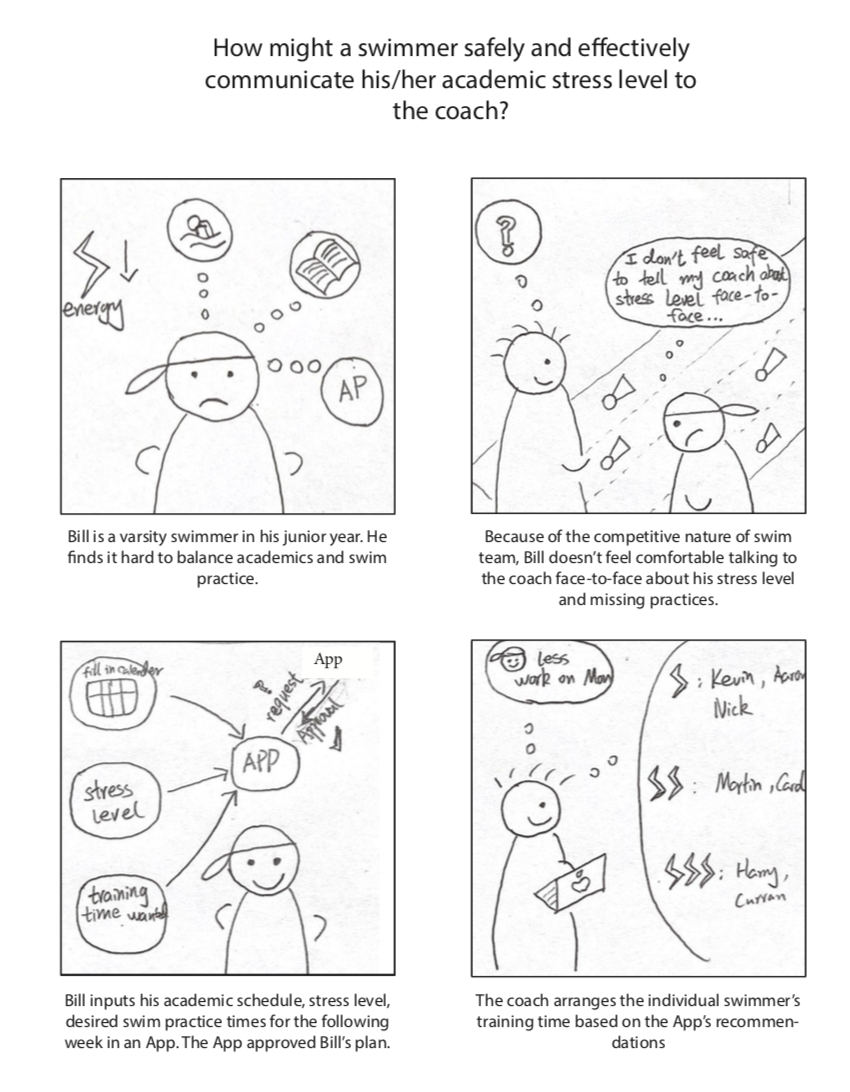
How might we keep our athletes well balanced to avoid getting overworked and burning out?
How might we prepare the next training session and advice for swimmers after a meet?
We speed dated six different sets of storyboards, and received feedback about what would be a valuable path to explore further in depth. Although we received positive feedback for providing the parent with highlights of their kid’s performance, we faced the issue of how highlights would be implemented as well as what recording technology would be needed at the meet.
As a team we found the storyboard where the student was able to communicate his academic workload to the coach an interesting avenue with the most potential for us to build a responsive web application. We wanted to build upon the current culture of elite sport for young athletes who also have to juggle all the preparation for college. It was a way to begin giving the coach insight into the mental health of his student, and being able to understand the underpinnings of his performance.
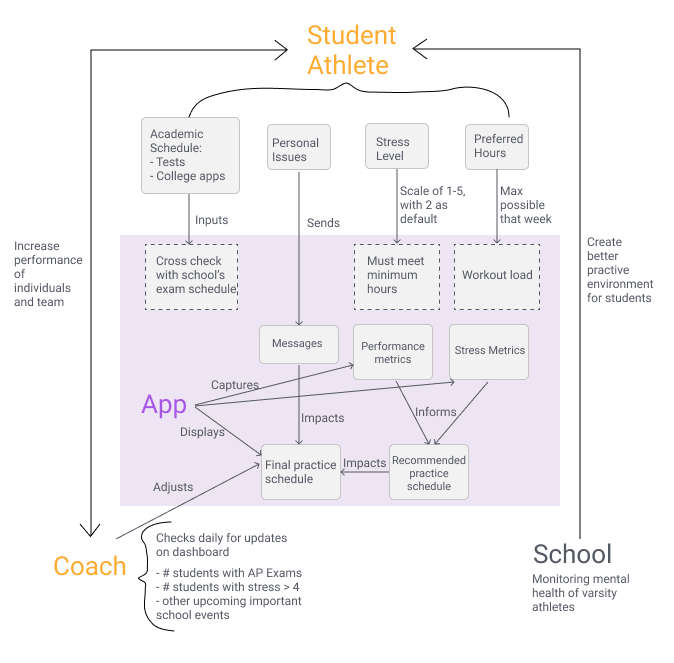
After narrowing on the need for balance, we used a concept map to outline information flow
Referring to Artifacts to ensure a match between the system and real world
Although we had the flow mapped out and knew the information we wanted our app to embody, it was still challenging to visualize how each feature would be presented to the user. We ensured to look through an existing app, MeetMobile, as well as images from our field research and the heat sheets we collected to delve into the data and information architecture.
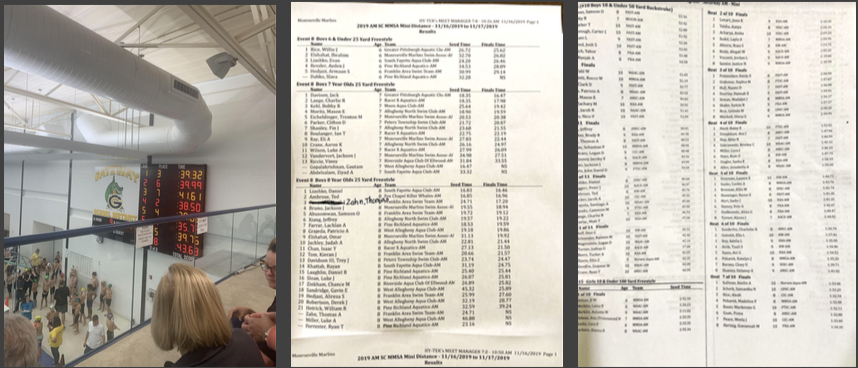
Cross referencing artifacts of the score board as well as swim heat sheets
In addition, we understood that the coach needed to have two separate views of the data:
Team Performance (View multiple teams, depending on the coach)
Individual Athlete Performance (View their specific statistics)
The coach needed to be able to quickly visualize the team’s performance after a swim meet, as well as be able to carefully select and dive deeper into an individual on the team. The coach needed to be able to have both views readily as well as be able to easily toggle between the two.
With a user flow created, we sketched our Initial Wireframes
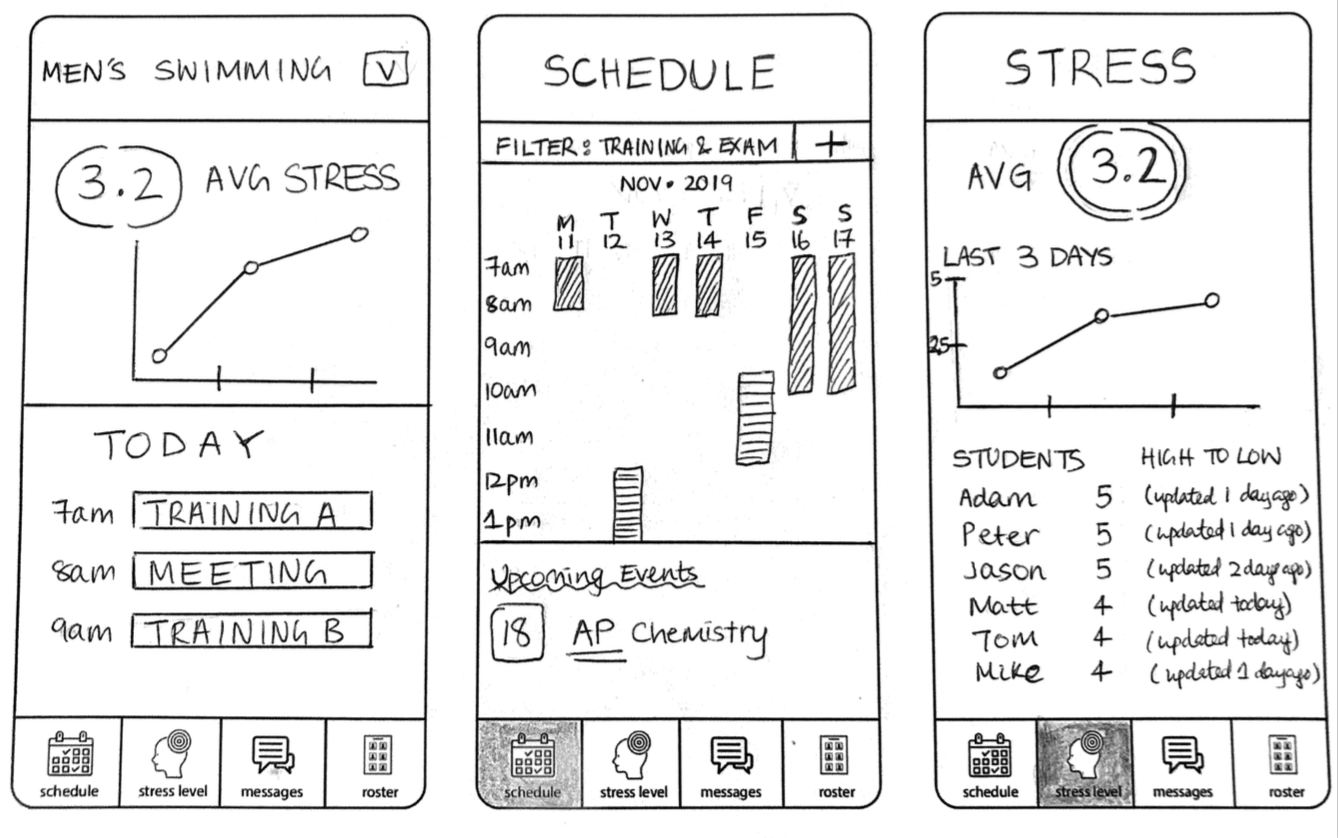
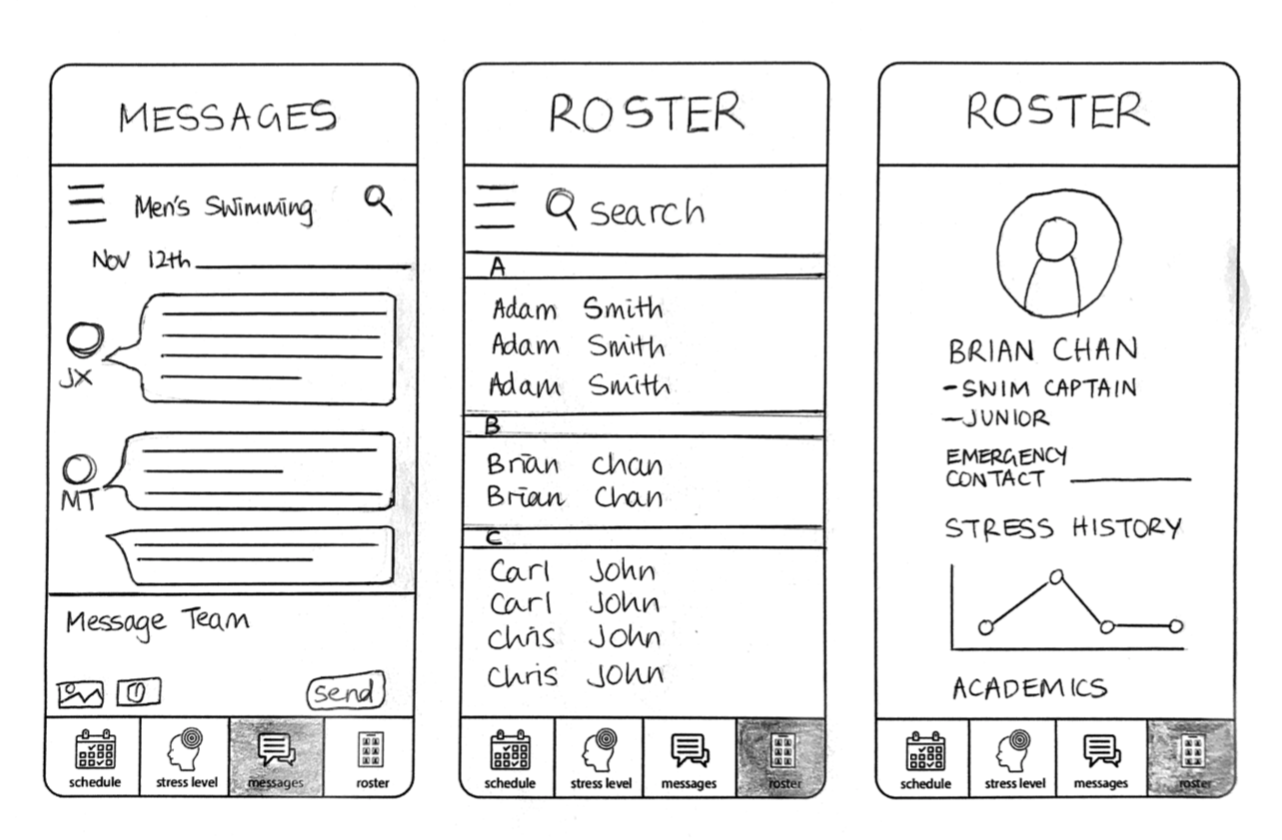
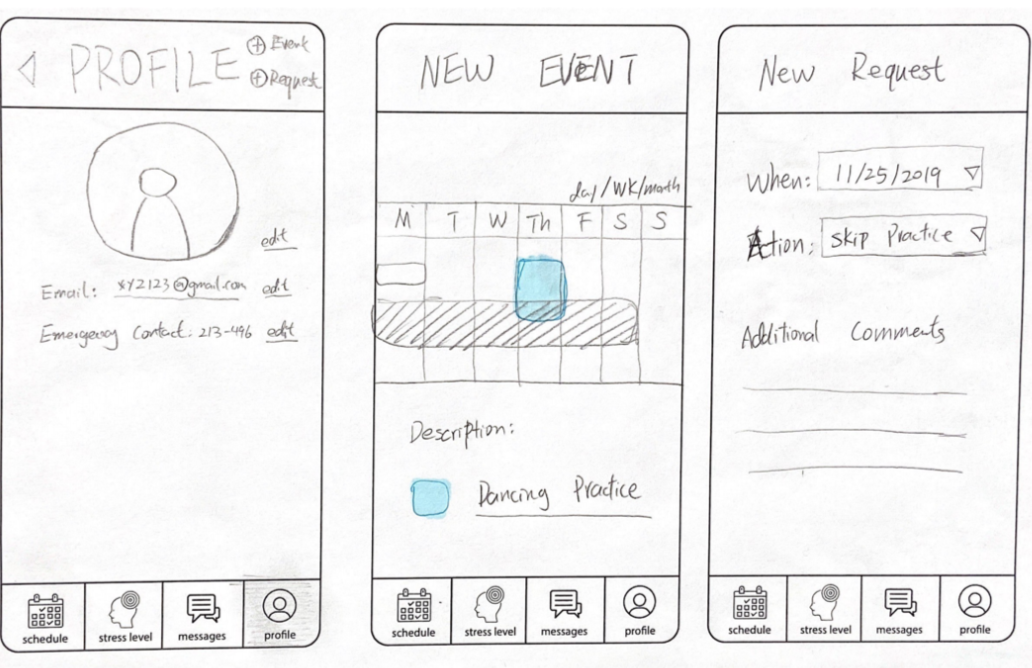
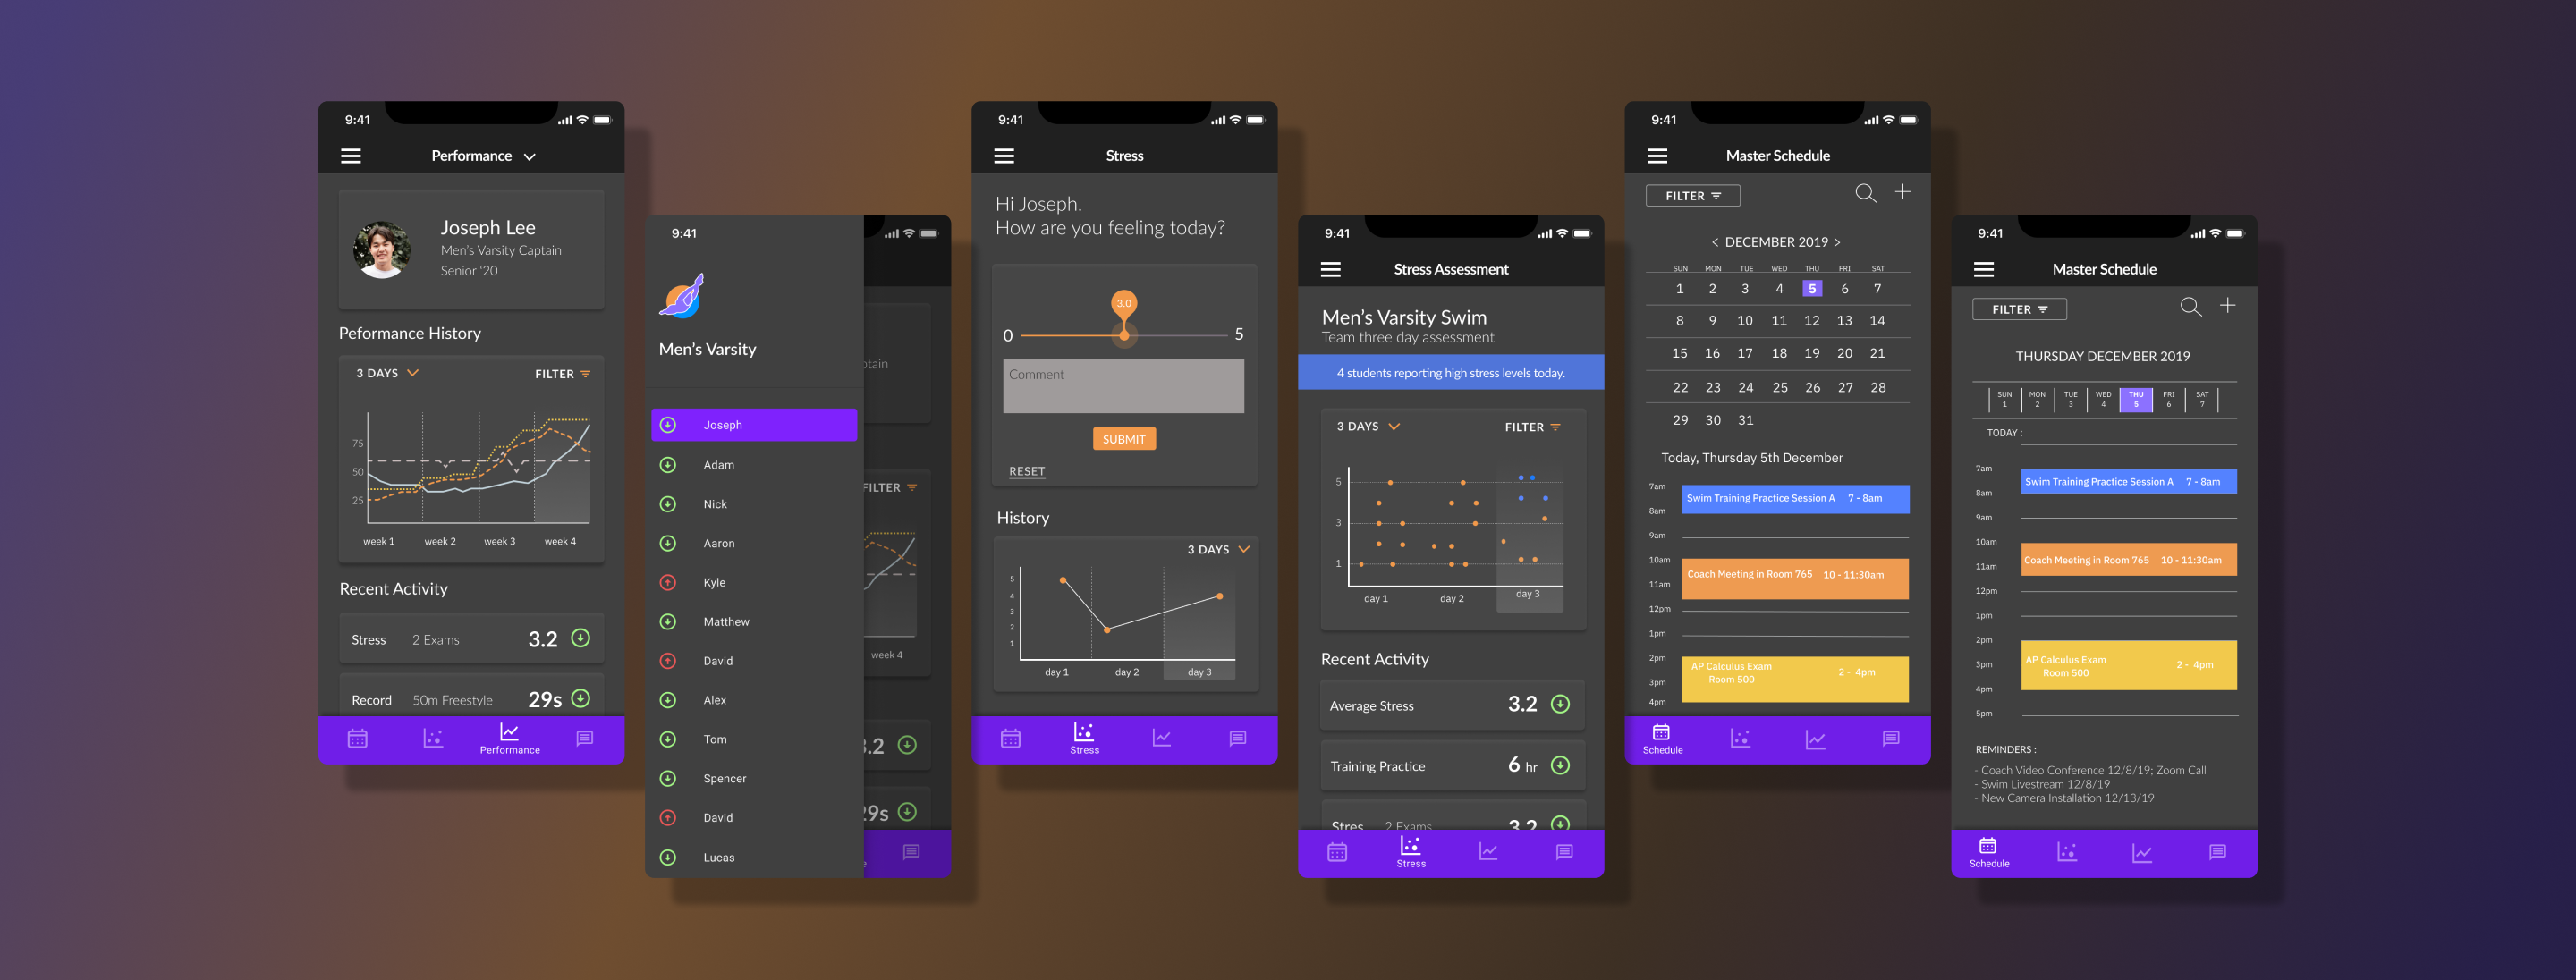
We decided to make a website that communicates student’s schedule, workload, and stress level with the coach. We made two versions: one for coaches, one for students. There are four key features for the coach: master schedule, student stress assessment, messages, and roster.
For the student version, the first three features are the same, and the last feature is replaced with a profile page. In addition, the students can add extracurricular events to the master schedule, and send request for less practice/excused practice.
After several rounds of critiques, we discovered that the key value of our product lies in communication and quantifying information.
We decided to shift our focus to performance data and create a data-driven design.
The Four Key Features

Schedule
View training practices and other academic events.
Stress
Monitoring stress levels and allowing athletes to enter theirs.
Performance
Viewing performance metrics of individuals and the team.
Messages
Simple communication between both parties.
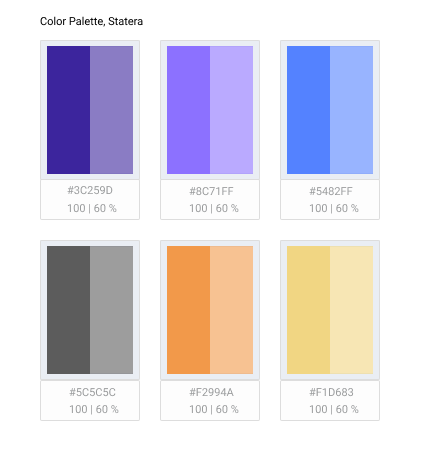
Color Palette Selection
The color palette we decided to go with incorporated the vibrant spirit and energy that comes from participating in youth sports as well as the sophistication in visualizing the data that is generated in order to better aid the performance of the team. Our team was inspired by the quick recognition of seeing a rise or fall in stock price, and incorporated a similar visual effect when a coach quickly glancing through the app to see which students may not have been performing as well in the past month. Moreover, with numerous line graphs being used we felt it would be easier for the coach to be able to understand what was being represented.
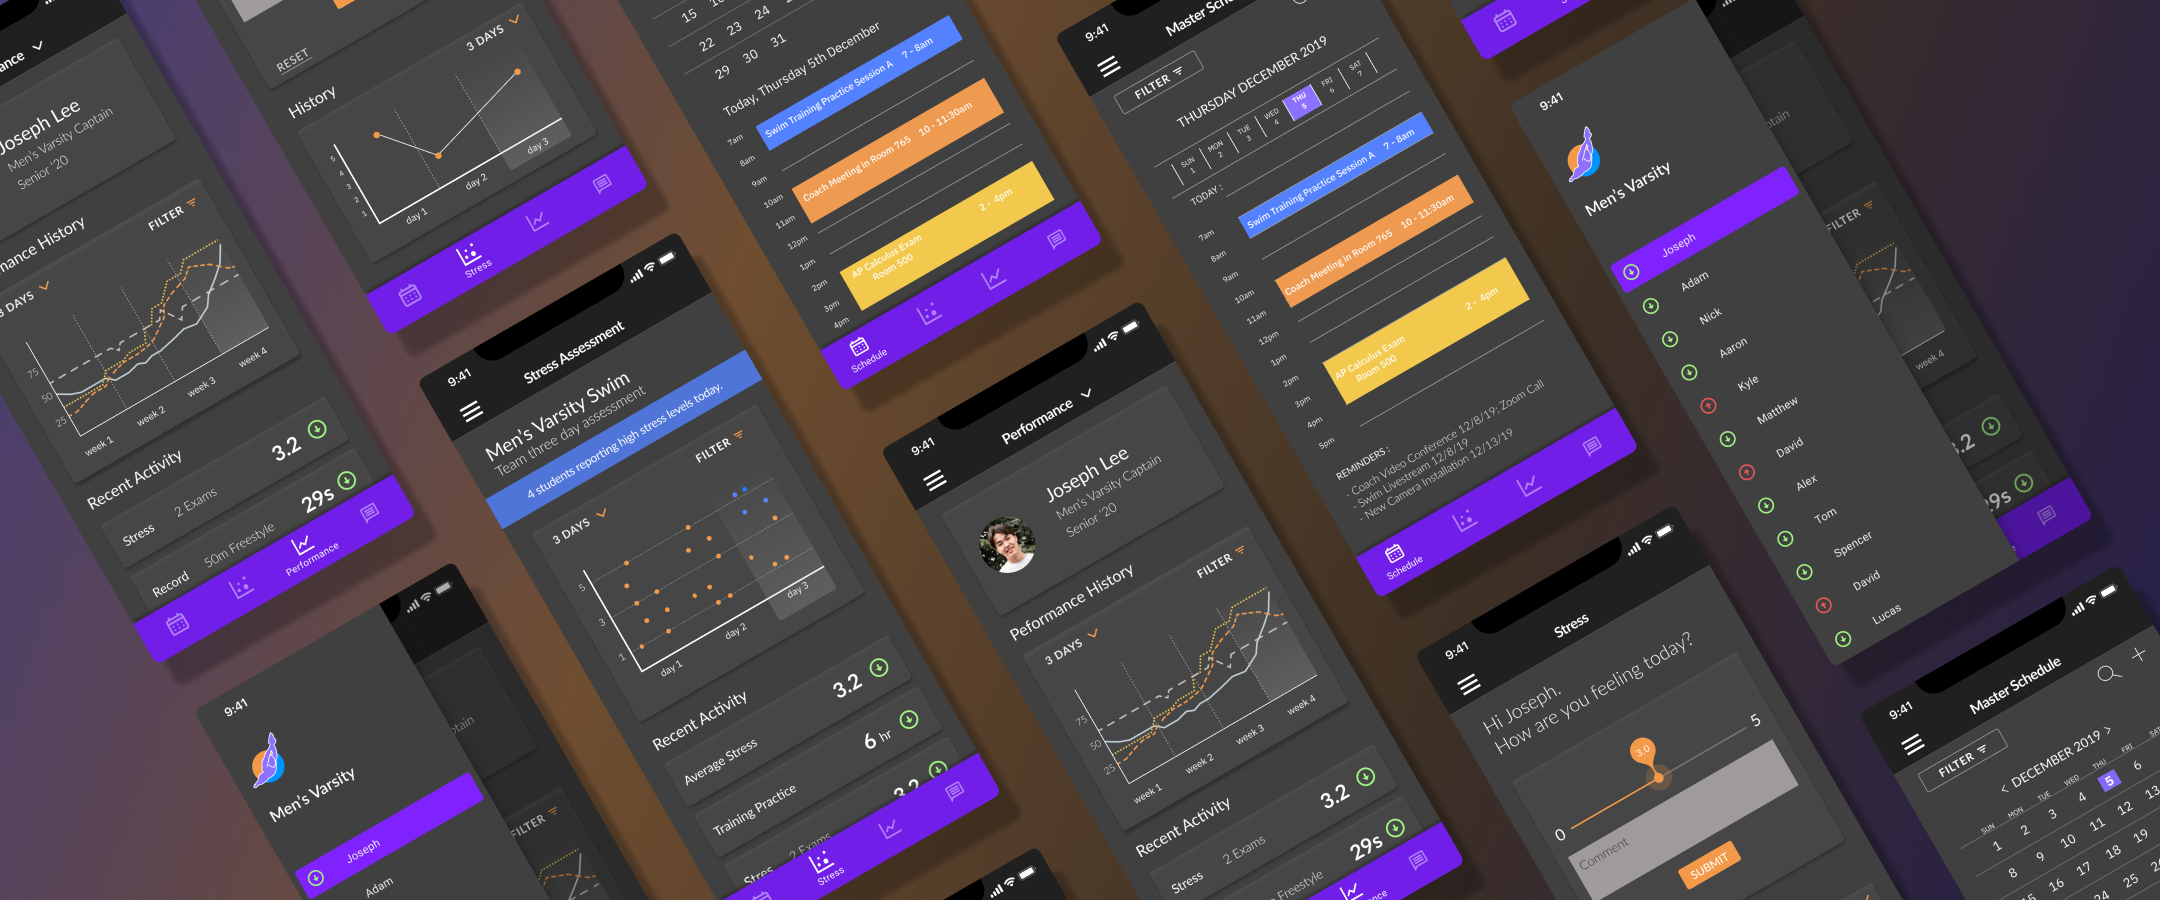
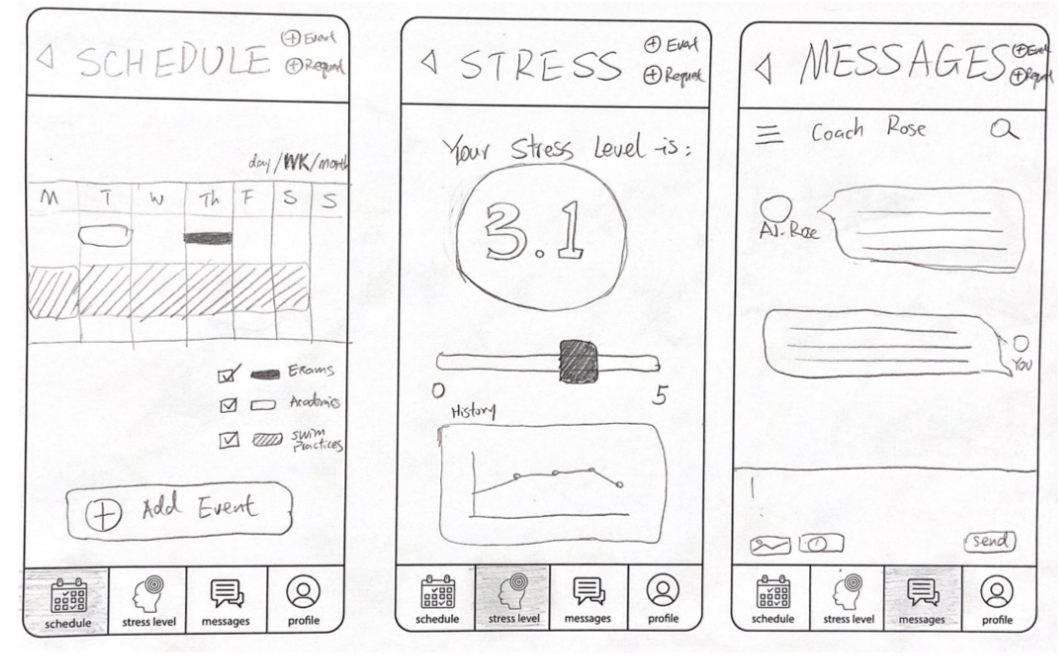
After several rounds of critique, we created a High-Fidelity Prototype
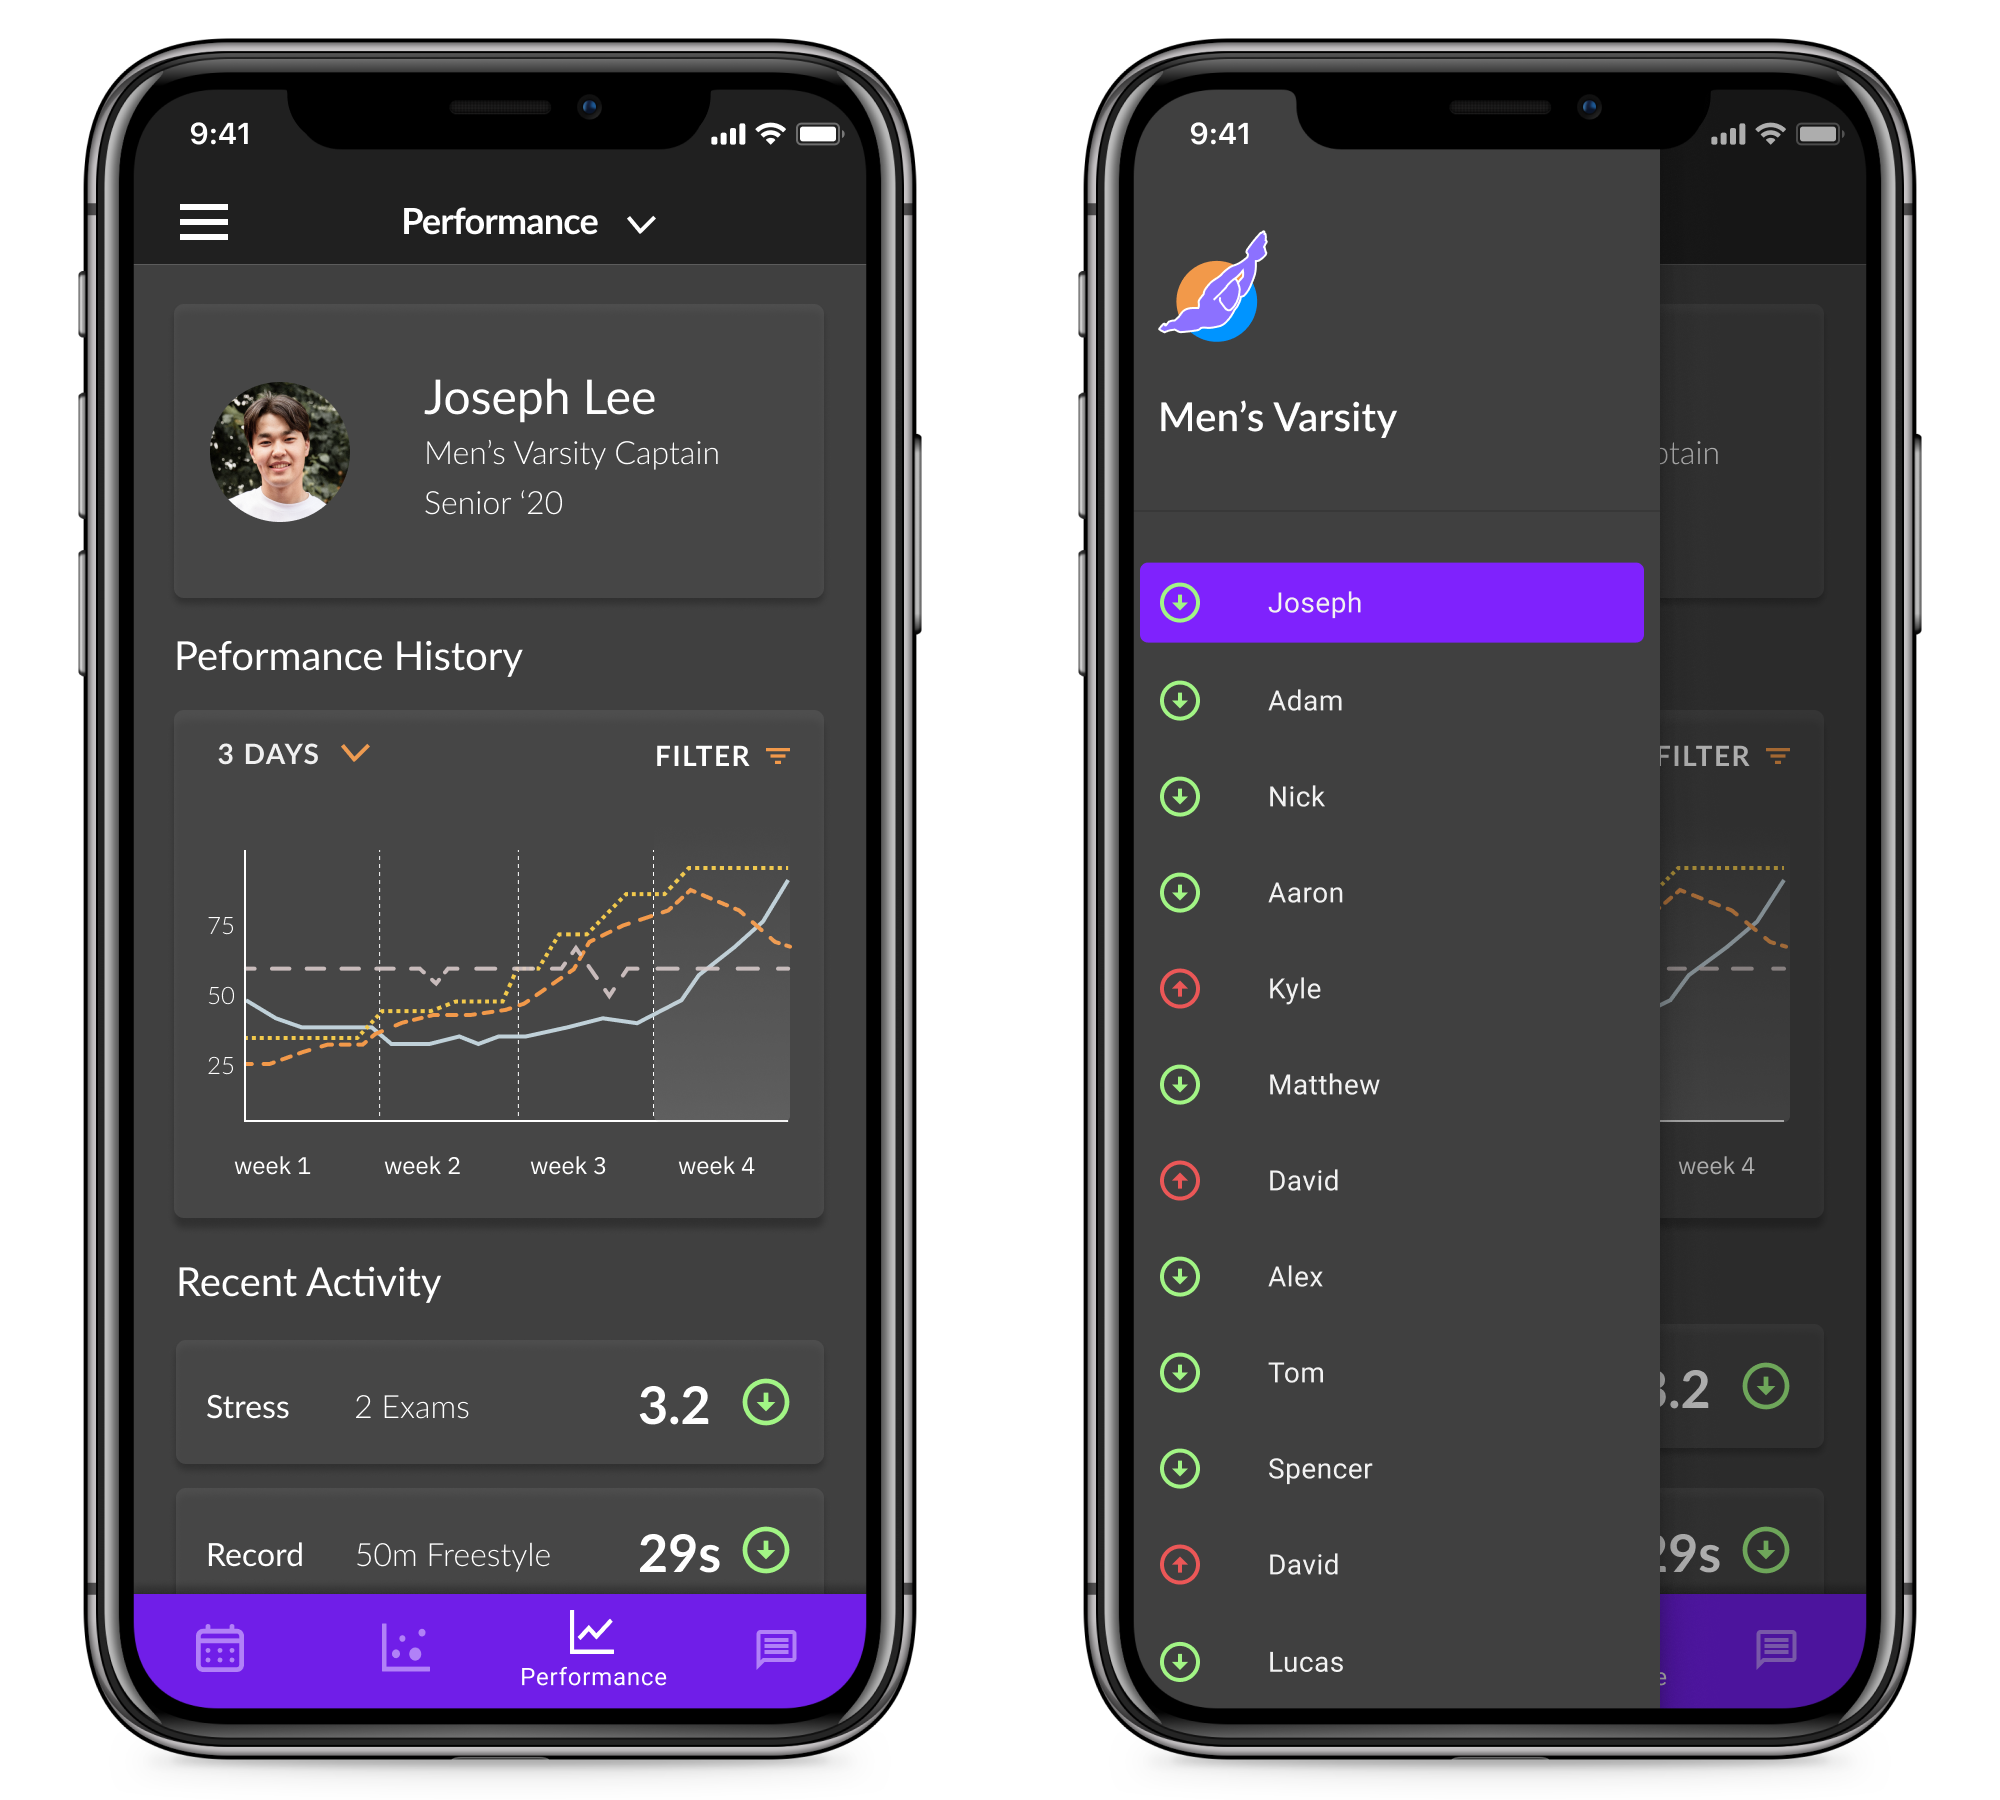
Performance
The coach is able to view the overall team performance, and easily toggle between each athlete to view their individual metrics
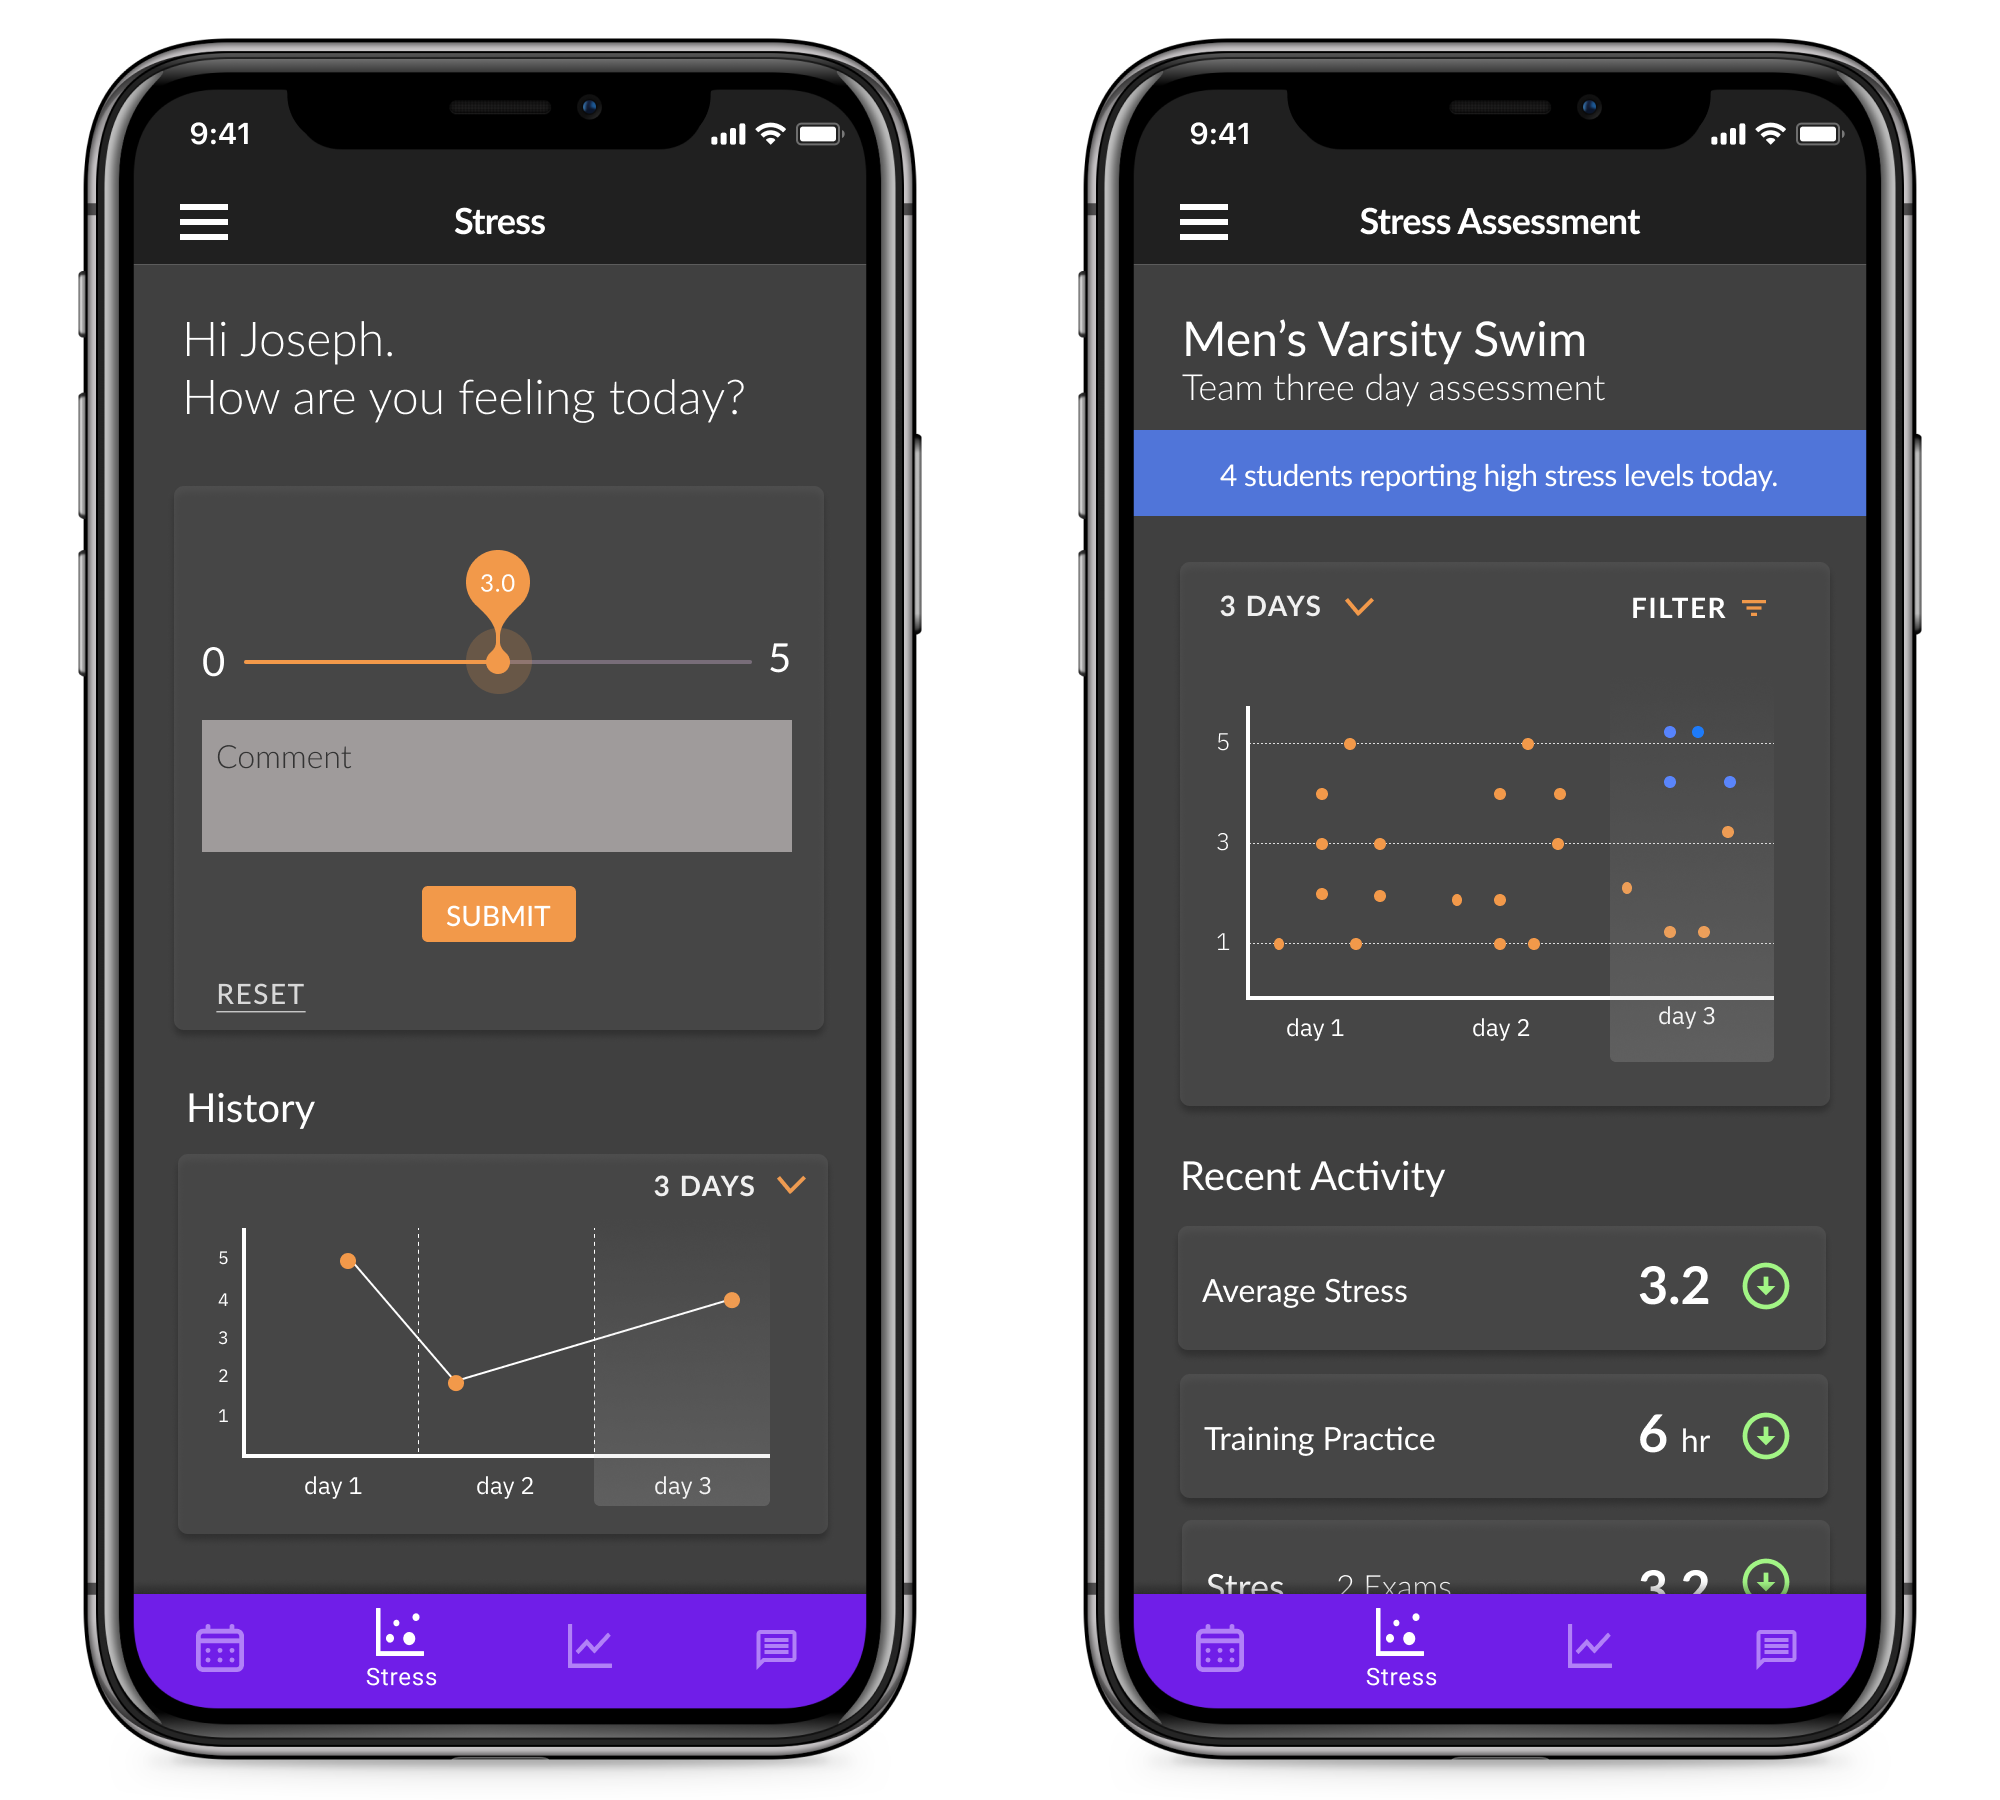
Stress Assessment
Athletes are able to indicate stress levels if desired, and coaches are able to see if any students need specific attention.
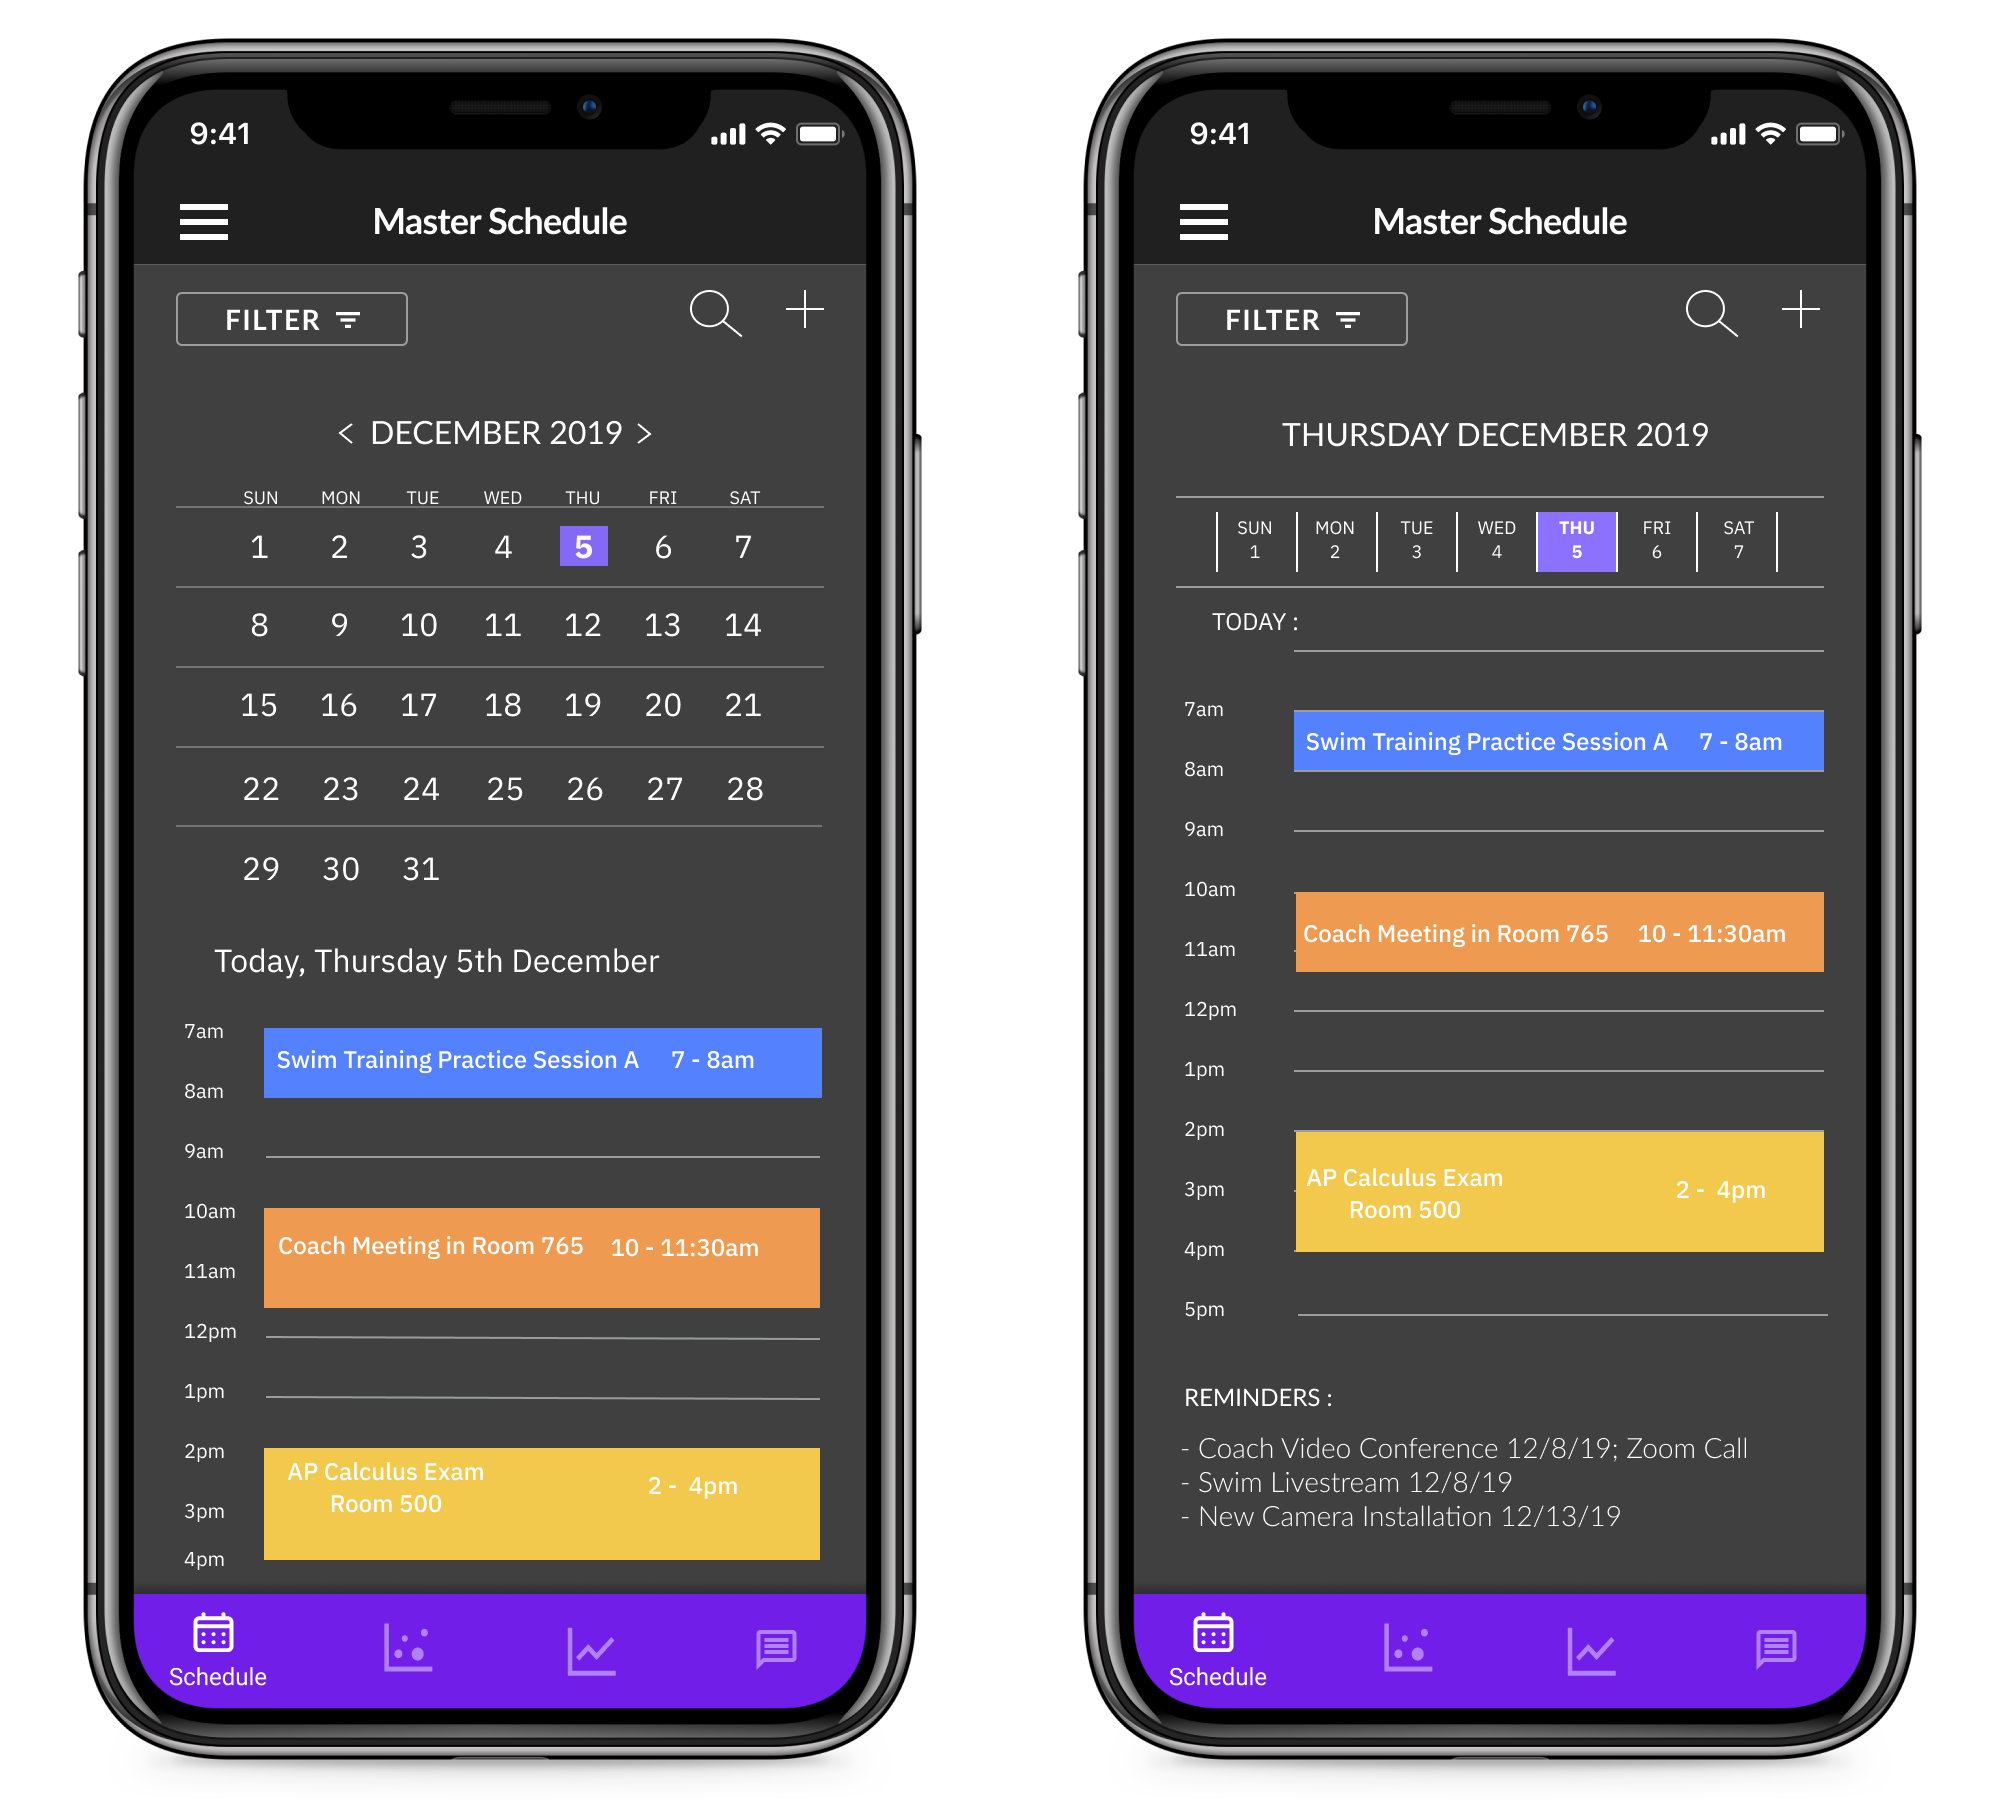
Schedule
Coaches are able to view the team’s schedule which is now synchronized with athlete’s academic commitments.
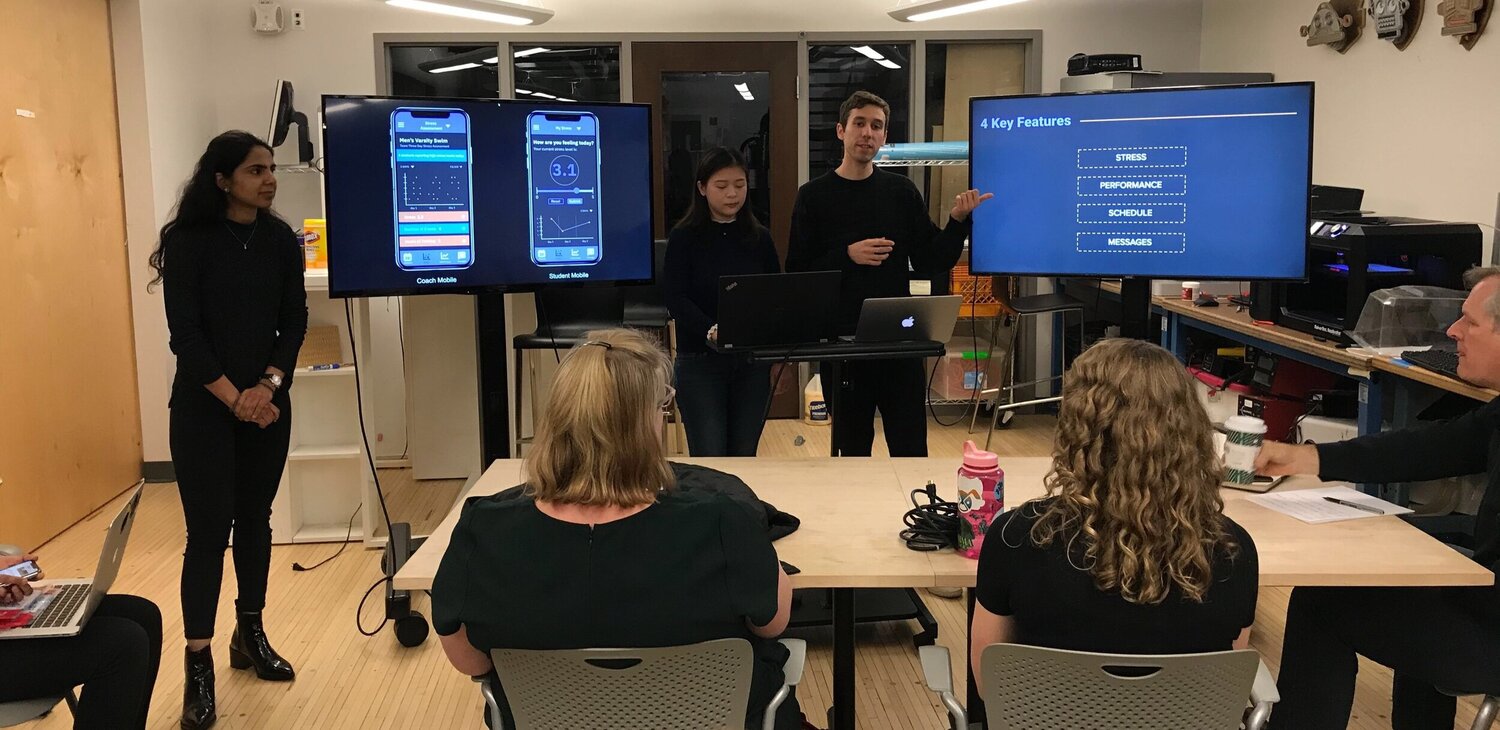
The Final Product Design Pitch
Our team pitched our final product to individuals from our local Pittsburgh community, including ex-varsity student athletes. The app is the beginning of a strong foundation for the mental health of athletes and systematic approach for coaches to manage their team to ensure healthy performance. Statera can have a positive impact on elite sport culture going forward and provide value for both coaches and young athletes today.
Reflection
Throughout the project we were able to delve into the existing culture of youth sports and develop a novel application that targeted finding a healthy balance between academics and elite sports for students. We believe we were able to create value for the student, coach and the school.
After pitching our application and receiving valuable feedback, the future development would include:
- Students having the choice to anonymously submit their stress level to the coach
- Managing the coach’s schedule when too much content is displayed
- Making useful suggestions for coach based on data: performance, stress level, schedule, etc
Selected Works